Calculating Scope 1, 2, 3: Why Your Method Matters More than the Outcome
Climate blog 4/5
In brief
- Without a solid baseline, you can’t steer your transition plan.
- Scope 1 and 2 are manageable for most companies. Scope 3 is usually the largest and the hardest.
- For each scope 3 category, you choose which data (spend or quantities) and which emission factor (industry average or supplier-specific) to use.
With industry averages, your suppliers’ efforts don’t show up in your numbers. - Start broad, refine the largest items, and bring your suppliers on board step by step.
“Why aren’t we seeing that in our numbers?”
Picture this: your baseline is in place, and so is your transition plan. You’ve switched to a supplier with cleaner production, and you’re proud of it. A year later, your director asks why that move doesn’t show up anywhere in your emissions figures. Chances are the answer lies not in your measures but in your calculation method. In this blog, we go back to basics: calculating your scope 1, 2, and 3 emissions. Above all, we look at why the way you calculate matters at least as much as the number it produces.
Where we are in this series
After the urgency of climate change [blog 1], we showed how a climate resilience analysis helps you map your organization’s risks [blog 2], and in [blog 3] we shared tips for a transition plan with realistic targets.
In this fourth blog, we dig into the foundation: the emissions calculation. How do you build a solid baseline that you can actually steer by in the years ahead?
Scope 1: what you emit yourself
Scope 1 covers emissions from sources you control, such as natural gas, your vehicle fleet, and refrigerants. You get the data from energy bills, fuel cards, and maintenance reports for your cooling systems. If you rent your building, the owner or property manager can often provide this data. Using the Dutch emission factor list at co2emissiefactoren.nl, you convert this into CO2 equivalents. Don’t forget refrigerants: even a small leak adds up quickly.
Scope 2: the energy you buy
Scope 2 covers the emissions generated in producing the electricity, heat, or steam you purchase. For most companies, this is also fairly straightforward: your energy bill tells you how much you use. You report two figures: location-based and market-based. The location-based method uses the average electricity mix of the grid. The market-based method looks at what you buy contractually, for example green electricity backed by guarantees of origin. If you opt for renewable energy, you have roughly three options: generating it yourself (such as solar panels on your roof), a green electricity contract with guarantees of origin, or a long-term contract with a specific wind or solar farm (a Power Purchase Agreement, or PPA).
Scope 3: where it gets more complex
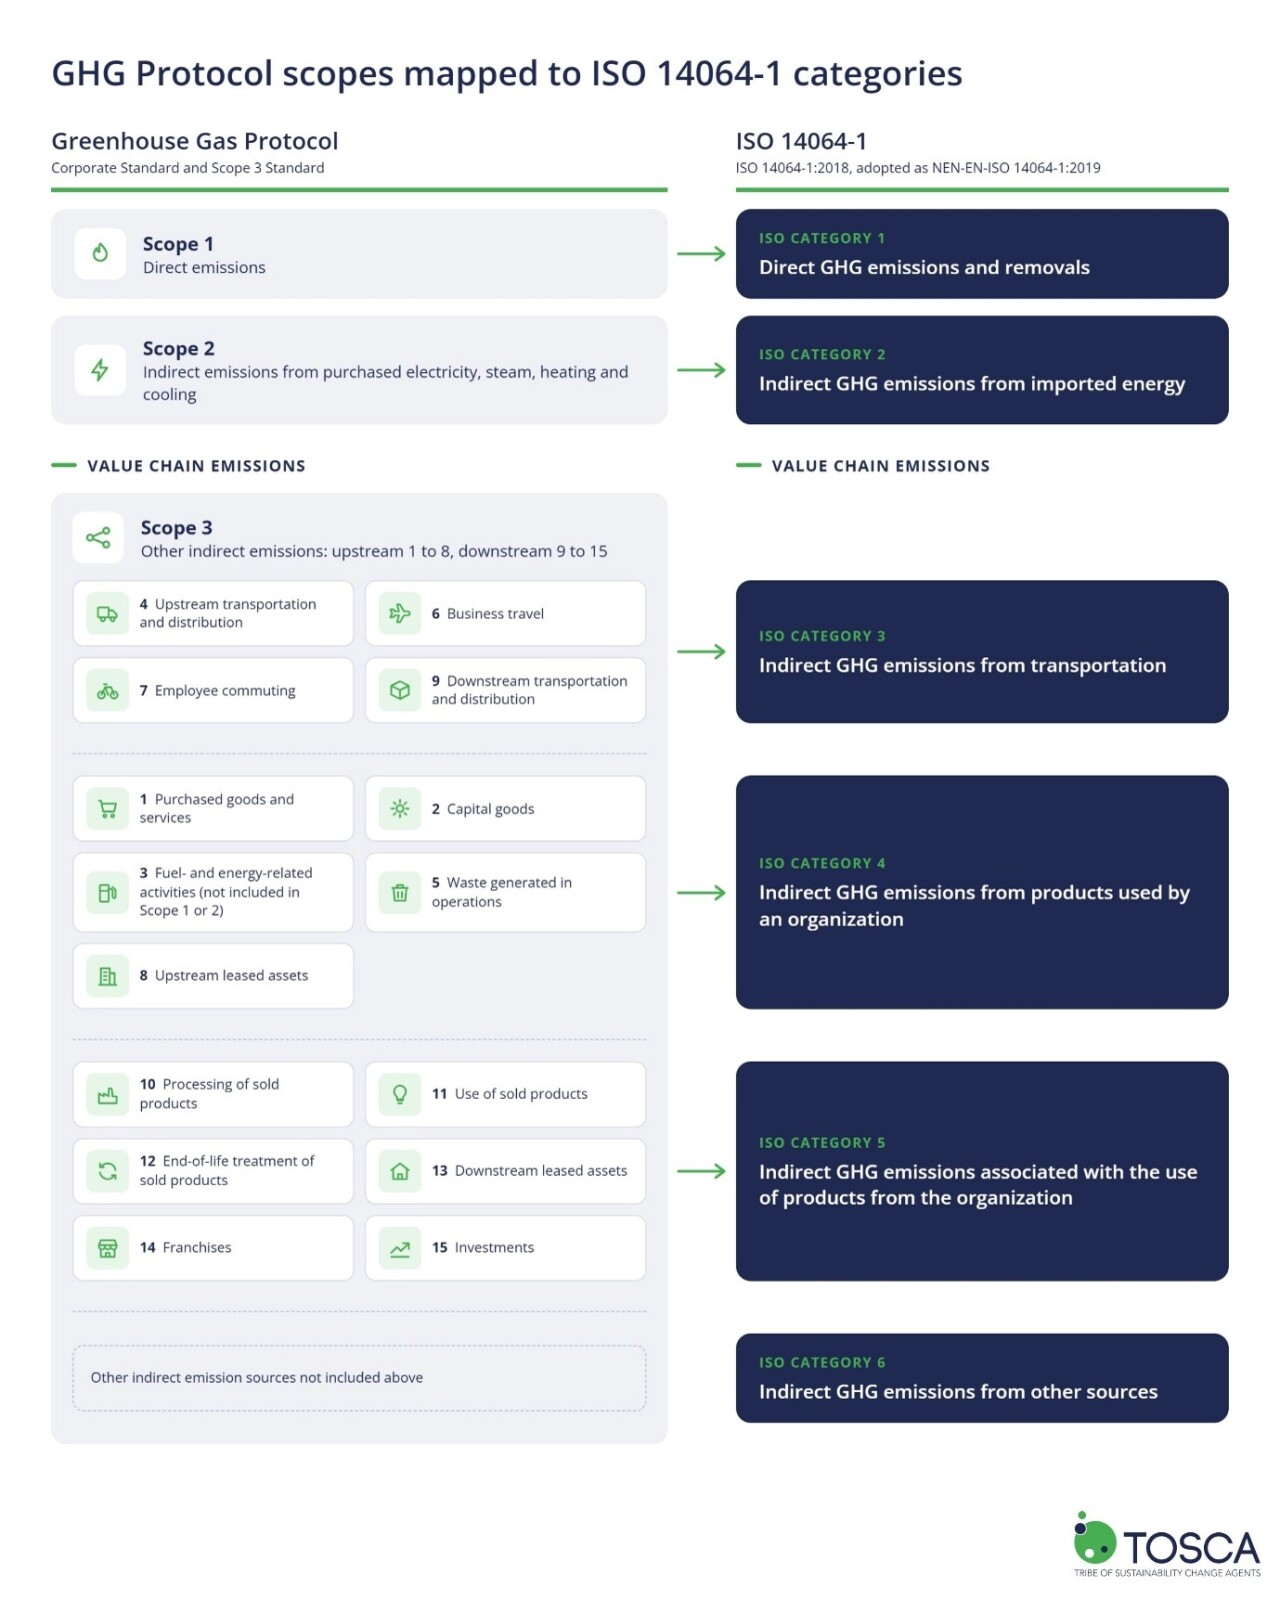
Scope 3 covers all other indirect emissions in your value chain, from purchased raw materials to the use and disposal of your products. For most companies, this is by far the largest share. The tricky part: these emissions occur at other companies, so the data usually sits with them too. There are exceptions: for business travel and commuting, you often already have the data in-house, through your travel records or a short employee survey.
In the Netherlands, you usually work with two standards. The GHG Protocol divides scope 3 into 15 categories, ranging from purchased goods to employee commuting. ISO 14064-1:2018 doesn’t use scopes; instead, it uses six categories: two for direct and energy-related emissions, and four for other indirect emissions. ISO also requires you to set criteria in advance for deciding which indirect emissions are significant, such as their magnitude, the influence you have over them, and data availability. You calculate the significant sources, and for anything you leave out, you explain why. This keeps you from measuring only what is easy to measure. Since Handbook 4.0 (mandatory from January 2027), the CO2 Performance Ladder uses both the GHG Protocol and ISO 14064-1. For organizational boundaries and scope 3, the Ladder mainly follows the GHG Protocol. In both cases, the underlying logic is the same: activity multiplied by emission factor.
The good news: the two are converging. The GHG Protocol and ISO are working on a single joint standard, with a public consultation in Q2 2027 and publication planned for Q4 2028. Until then, the current standards remain fully valid.
Spend or activity? Both!
For scope 3, you make two choices per category:
- Which data do you use? Your spend in euros (spend-based) or physical quantities such as kilograms, kilometers, or kilowatt-hours (activity-based).
- Which emission factor do you use? An average for the industry or product? Or a supplier-specific factor, such as your supplier’s emissions per euro of revenue or the footprint of the product you buy?
The more specific both choices are, the more accurate your result. This isn’t an either-or decision for your entire footprint. Spend-based data with industry averages quickly gives you a complete overview and shows where the big items are. For those big items, you then switch to activity data and, where possible, to factors from your suppliers.
The progress problem with averages
An industry average doesn’t describe individual suppliers. A supplier that has been investing in cleaner production for years gets the same number as a competitor that does nothing. So you can’t see who is performing well.
What happens in the following years is even trickier. If your supplier halves its emissions while your spend stays the same, a spend-based calculation shows no change. If you get a discount, your emissions drop on paper. If prices rise due to inflation, you need to correct for it, or your emissions will rise on paper too. Some databases already do this for you; with others, you have to do it yourself. With a spend-based method, almost the only way to reduce your emissions is to buy less. For a transition plan, that’s fatal: you can’t show that your measures are working.
In short, spend-based scope 3 figures move mainly with sales volumes, product mix, and spend-based factors, not with what suppliers actually reduce.
How do you get suppliers moving?
Getting data from suppliers is often the hardest part. Here’s what works in practice:
- Start small. Focus on the five to ten suppliers you buy the most from or that emit the most. It doesn’t all have to happen in one year or reporting cycle: expand the number of suppliers step by step.
- Explain why. A supplier that understands you want to collaborate rather than penalize is more likely to share.
- Make it easy. A large Dutch supermarket chain built an online hub with explanations, instructional videos, and a step-by-step plan, so that even small suppliers can calculate their emissions. On a smaller scale, a simple template goes a long way.
- Embed it in your procurement. Include the request in contracts or award criteria.
- Build on what already exists. More and more suppliers already have this data on hand. Other customers, banks, or investors may have asked for it already, or the supplier may have collected it for EcoVadis, B Corp, or the CO2 Performance Ladder. So ask what’s already available first, instead of demanding a new calculation.
Five practical tips
- Lay a solid foundation. Choose a representative base year and define which parts of the business are included. Then make scope 1 and 2 airtight: that’s the easiest win and often the first thing an auditor or customer asks about.
- Use spend-based data as a map, not a destination. First get a rough picture of everything, then refine the three to five largest items with actual quantities.
- Ask suppliers a concrete question. Ask for the emissions of the product you buy from them (per product or per euro). And prepare your own answer, because your customers will ask you the same thing.
- A baseline that evolves is normal. Better data shifts your number, sometimes upward: you’re measuring better, not emitting more. A merger or acquisition also changes your boundaries and therefore your number. When that happens, recalculate your base year so the comparison stays fair, and brief your leadership in advance.
- Get a fresh pair of eyes. Whoever does the calculation often stops seeing their own assumptions. Have an external expert review your method, assumptions, and calculations. That way, you catch errors before an auditor, customer, or certification body does.
Final thoughts
A baseline is a navigation tool: it shows where you are and whether you’re on course. A method that shows whether your measures are working matters more than a final number. Start broad, refine where it counts, and bring your suppliers along.
In the next blog, we look at what remains once you’ve reduced everything you can: what role do carbon credits and carbon removals play?
Want a more accurate picture of your CO2 emissions? Get in touch with TOSCA.
Author: Pedram Keshmiri | pedram@toscatribe.nl